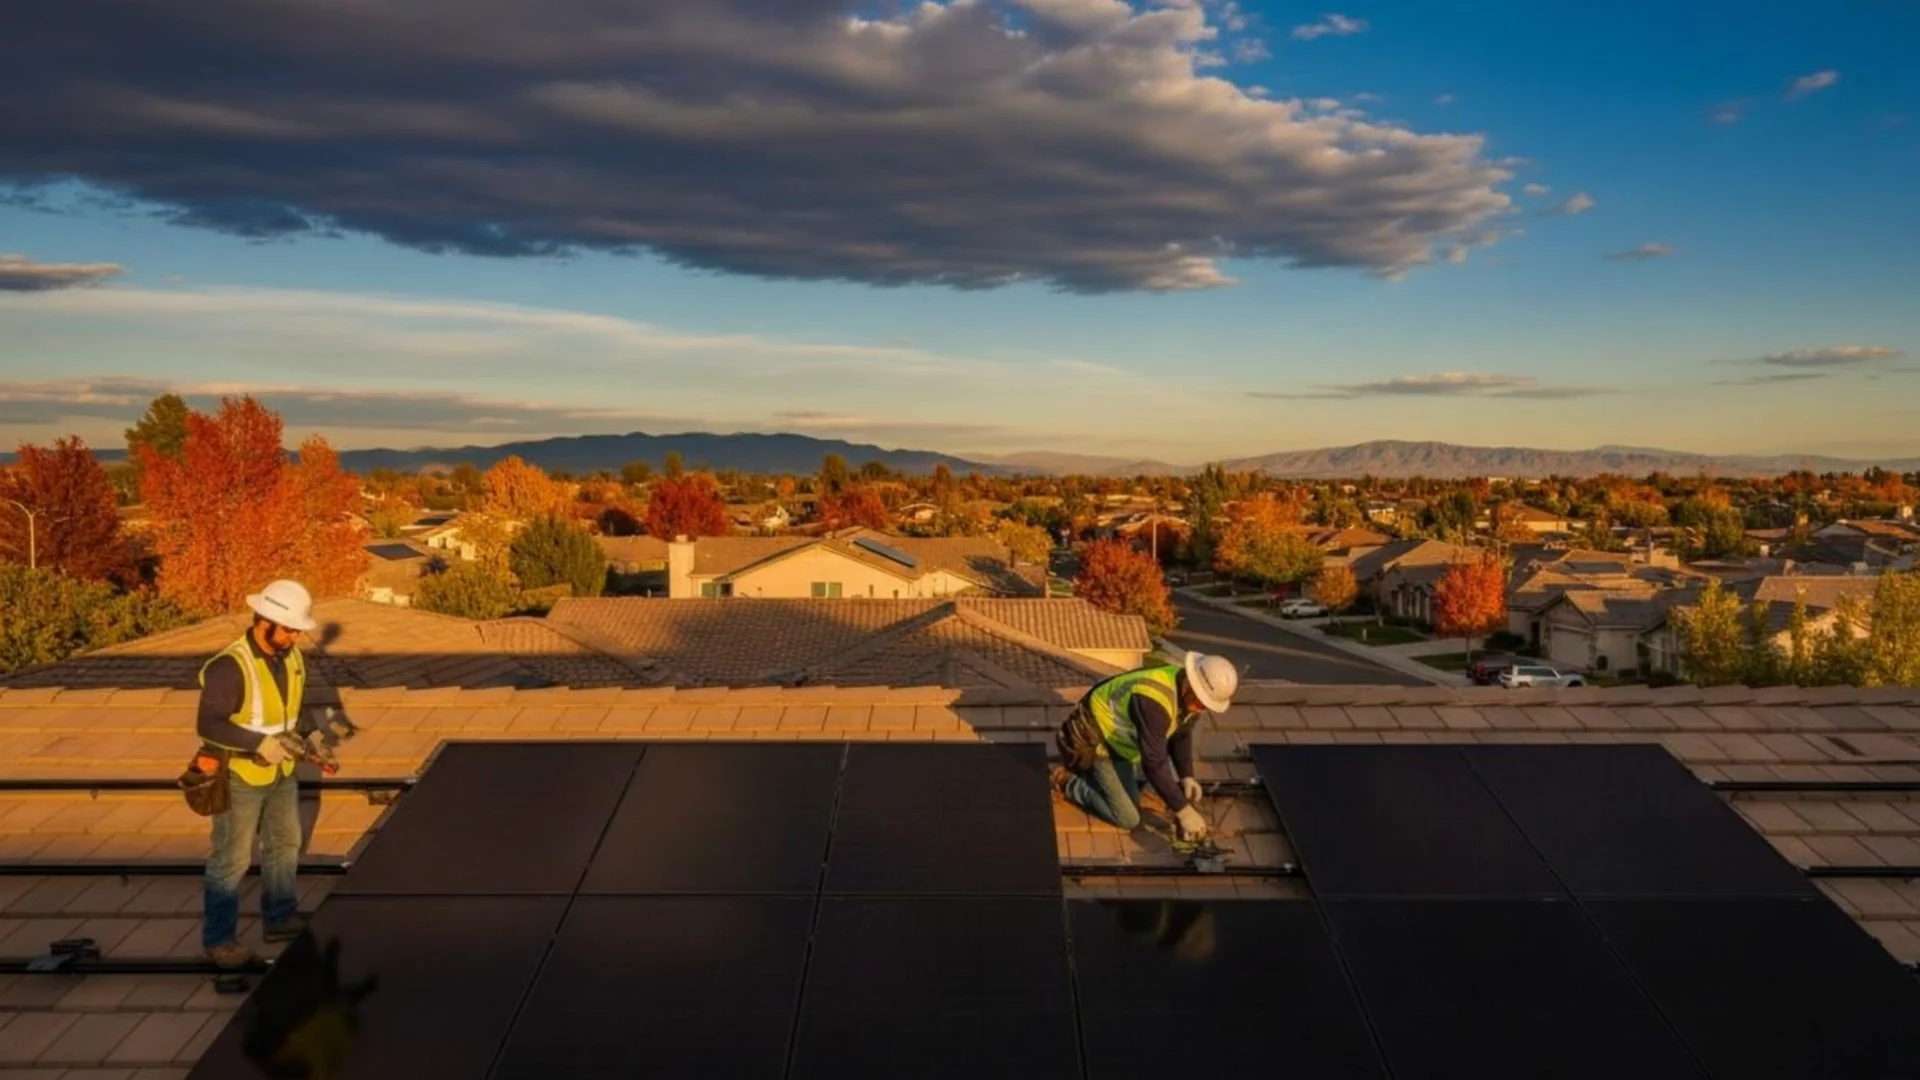
Your solar app shows two main things: how much power the panels make (production) and how much your home uses (consumption). Learn what a normal day looks like, and the patterns that point to a fault become easy to spot.
What your solar app is actually showing you
Every brand has its own app: Enphase, SolarEdge, Tesla and others. The layouts differ, but they all track the same few flows of energy: what the panels make, what the house uses, what goes to or comes from the grid, and what goes in or out of a battery if you have one.
Production is solar output. Consumption is everything your home pulls, from the AC to the fridge. When production is higher than consumption, the extra goes to the grid or the battery. When consumption is higher, you buy the difference from the grid, as this production vs consumption guide explains.
One thing surprises many owners: some apps show production only. Seeing consumption needs extra sensors, called consumption CTs, clamped in your electrical panel. Enphase, for example, notes that consumption data depends on that metering. If your app has no consumption line, it may never have been installed or turned on.
The numbers on the main screen, in plain English
- kW (power right now): How fast the system is producing at this moment. It rises in the morning, peaks around midday, and falls to zero at night.
- kWh (energy over time): The total produced over a day, month, or year. This is the number to compare with your electric bill and your installer's estimate.
- Grid import and export: Import is power you bought. Export is extra solar sent out. If you only watch production, you miss why your bill moves.
- Battery charge: How full the battery is. A healthy battery charges during the day and drains in the evening or during an outage.
- Last update time: When the system last reported. An old timestamp usually means a Wi-Fi or gateway problem, not a dead system.
What a normal day looks like
On a clear day, the production graph looks like a smooth hill: low at sunrise, highest around midday, back to zero at sunset. Cloudy days look jagged, with sharp dips as clouds pass. That is normal and not a fault.
The seasons change the size of the hill. Winter days are shorter and the sun sits lower, so daily totals drop even when nothing is wrong. That is why a single bad-looking week tells you little, and why the yearly view is the best place to judge how the system is really doing.
On some string inverter systems, the top of the hill may look cut flat on the sunniest hours. That is often clipping: the panels can make more than the inverter is rated to pass, so it caps output. This clipping explainer covers why a small amount is normal. The flat top should sit at the inverter's rated output. A flat line well below it is worth asking about.
Consumption has its own shape. In a Texas or Florida home, it often climbs in the late afternoon and evening, when the AC runs hard and solar is fading. That gap is why adding a battery to existing solar comes up so often.
A 10-minute check you can do today
- Pick a clear day. Open the daily view for a recent cloudless day. Cloudy days hide problems because the curve is messy anyway.
- Look at the shape. Is it a smooth hill from sunrise to sunset? Note any sudden drop to zero, a curve that starts late, or one that ends early.
- Compare the same month last year. Switch to the monthly or yearly view. Compare this month with the same month last year, not with last month, because the seasons change output a lot.
- Compare with an estimate. Use the production estimate from your original proposal, or run your address and system size through NREL's free PVWatts calculator for a monthly ballpark.
- Open the panel view. Many systems with microinverters or optimizers show each panel. A panel that is dark or much lower than its neighbors is a clear lead.
- Check the last update. If data stopped days ago, check that the gateway has power and Wi-Fi before assuming the panels stopped.
Patterns that point to a problem
- Zero all day on a sunny day: The system is off. Start with the safe checks in our guide to a solar inverter not working.
- One panel always low: Usually a failed microinverter or optimizer, new shade, or a wiring issue on that panel. It will not fix itself.
- Output stops at the same hour daily: Often new shade from a growing tree or a new structure. Check the roof from the ground at that hour.
- A sudden step down that stays: Output drops one day and never recovers. Think storm damage, a tripped string, or a failed part. Get it inspected.
- Gaps with no data: Blank stretches usually mean the monitoring lost connection. The panels may be fine, but you are flying blind until it is fixed.
Slow decline: how much is normal?
All systems lose a little output each year. NREL's study of U.S. systems found a median loss of about 0.75% per year, with hotter climates losing about 0.88% per year versus about 0.48% in cooler ones. The same study found 90% of systems lost less than 2% per year.
So a slow slide year after year, close to those numbers, is expected aging. A drop much faster than that, or a sudden step down, is not. Heat also matters day to day: rooftop panels can run far hotter than the air around them, and hot panels produce a bit less. A July day with a slightly lower peak than a clear spring day is normal.
When production looks fine but the bill does not
Sometimes the app shows strong production and the bill still climbs. That usually means consumption grew, or more of your solar is going out to the grid at a low credit while you buy power back in the evening. The consumption and grid views show which one it is.
We break this down in why your solar bill is still high in Texas and in what happened to Texas buyback rates. If evening imports are the problem, a home battery can store midday solar for later.
What to send a technician
- A screenshot of a clear-day production curve from this week and one from the same month last year.
- The panel-level view, if your app has one, showing which panels are low or dark.
- Any alert or error code shown in the app or on the inverter screen.
- The brand and model of your inverter and the year the system was installed.
- Whether the original installer is still in business. If not, our project rescue team works on systems other companies installed.
Frequently Asked Questions
Consumption needs extra sensors, called consumption CTs, installed in your electrical panel and turned on in the system settings. Many systems were installed with production monitoring only. A licensed technician can check whether the sensors exist and whether they were set up correctly.
Peak output on very hot days can be a bit lower because hot panels are less efficient. Longer days often make up for it in total daily energy. Compare a month with the same month last year rather than with the month before.
On sunny days with string inverters, a flat top is often clipping: the inverter is capping output at its rated limit. That is usually normal. If the flat line sits well below the inverter's rating, or shows up on cloudy days too, ask a technician to look.
Compare clear-day output with the same month in past years and with your original production estimate. Check the panel view for one panel that runs lower than the rest. A sudden drop that stays, or a decline much faster than normal aging, points to a fault worth inspecting.
Most of the time the gateway lost power or Wi-Fi, often after a router change or an outage. The panels may still be producing. Restore the connection first, then check whether production data comes back for the missing days.